Career Information
Your entire educational career has been leading up to this moment: finding the right career. It's your time to shine, but where? With so many careers in so many different industries, figuring out what you want to do can be a difficult task. We're here to help. Use the dropdown menu below to start researching your new career, and get ready to learn everything you need to know, including:
- Salaries, both national and by metropolitan area
- Number of people who work in that profession
- Necessary traits
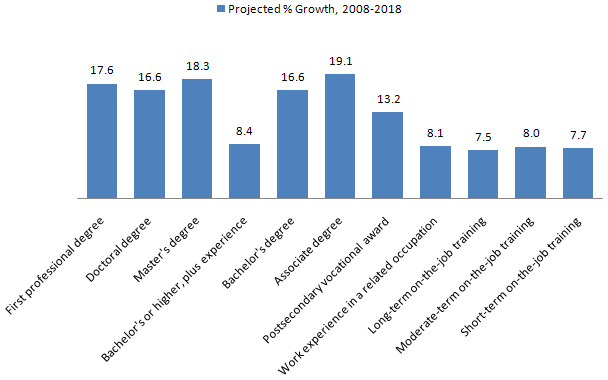
It's no secret that education directly affects employment. To give you an idea of just how true that is, here's a great graph illustrating how careers that require a higher level of training are projected to grow from 2008 through 2018, according to the U.S. Bureau of Labor Statistics:
Get info on careers in…
| Occupation | Employees | Median Annual Salary |
Median Hourly Wage |
Top 25% Annual Salary |
Top 25% Hourly Wage |
2018 Change |
2018 % Change |
|---|---|---|---|---|---|---|---|
| Fashion Consultants | 15,780 | $64,300 | $30.90 | $90,000 | $43.30 | 200 | 0.8% |
| Film and Movie Editors | 17,550 | $50,800 | $24.40 | $79,600 | $38.20 | 3,000 | 11.9% |
| Floral Arrangers | 51,470 | $23,500 | $11.30 | $29,600 | $14.20 | -1,900 | -2.5% |
| Interior Decorating Consultants | 46,010 | $46,200 | $22.20 | $63,600 | $30.60 | 13,900 | 19.4% |
| Motion Picture Camera Operators | 17,540 | $42,900 | $20.60 | $61,300 | $29.50 | 2,400 | 9.2% |
| Multimedia Artists and Animators | 28,800 | $58,300 | $28.00 | $77,400 | $37.20 | 11,200 | 14.2% |
| Musical Directors and Composers | 14,330 | $45,100 | $21.70 | $61,600 | $29.60 | 5,300 | 10.0% |
| Photojournalists | 57,760 | $29,800 | $14.30 | $44,200 | $21.30 | 17,500 | 11.5% |
| Production Artists | 200,870 | $43,200 | $20.80 | $58,100 | $28.00 | 36,900 | 12.9% |
| Retail Merchandise Displayers | 61,280 | $26,000 | $12.50 | $33,000 | $15.80 | 6,000 | 7.1% |
| Singers and Other Musicians | 47,260 | $46,500 | $22.40 | $77,100 | $37.10 | 14,200 | 7.6% |
| Sports Media Workers | 1,745,670 | $42,500 | $20.40 | $63,600 | $30.60 | 332,600 | 12.1% |
| Occupation | Employees | Median Annual Salary |
Median Hourly Wage |
Top 25% Annual Salary |
Top 25% Hourly Wage |
2018 Change |
2018 % Change |
|---|---|---|---|---|---|---|---|
| Administrative Support Assistants | 22,336,450 | $30,400 | $14.60 | $40,100 | $19.30 | 1,842,100 | 7.6% |
| Auditing Clerks | 1,757,870 | $33,500 | $16.10 | $41,300 | $19.90 | 212,400 | 10.3% |
| Auditors | 1,106,980 | $60,300 | $29.00 | $79,500 | $38.20 | 279,400 | 21.7% |
| Budget and Policy Analysts | 60,970 | $66,700 | $32.10 | $83,100 | $40.00 | 10,100 | 15.1% |
| Business Consultants | 552,770 | $75,300 | $36.20 | $101,400 | $48.80 | 178,300 | 23.9% |
| Businesspeople and Finance Workers | 6,063,670 | $58,900 | $28.30 | $79,600 | $38.20 | 1,209,900 | 17.7% |
| Econometricians | 13,160 | $86,900 | $41.80 | $119,600 | $57.50 | 900 | 5.8% |
| Executive Assistants | 1,361,170 | $41,700 | $20.00 | $52,200 | $25.10 | 204,400 | 12.8% |
| Financial Services Counselors | 81,650 | $30,600 | $14.70 | $36,400 | $17.50 | 100 | 0.1% |
| General Office Workers | 2,815,240 | $26,100 | $12.60 | $33,000 | $15.90 | 358,700 | 11.9% |
| General Purchasing Engineers | 281,910 | $54,800 | $26.40 | $72,100 | $34.70 | 40,900 | 13.9% |
| Human Resources and Training Specialists | 219,240 | $56,400 | $27.10 | $74,500 | $35.80 | 47,200 | 21.0% |
| Human Resources Coordinators | 35,630 | $88,100 | $42.30 | $115,200 | $55.40 | 3,400 | 8.5% |
| Human Resources Supervisors | 62,990 | $96,600 | $46.40 | $127,300 | $61.20 | 5,800 | 9.2% |
| Insurance Claims and Policy Processors | 235,480 | $34,000 | $16.40 | $41,300 | $19.90 | 700 | 0.3% |
| Job Analysis Specialists | 111,890 | $55,600 | $26.70 | $70,100 | $33.70 | 28,700 | 23.6% |
| Job Placement Specialists | 198,190 | $46,200 | $22.20 | $64,400 | $31.00 | 58,000 | 27.9% |
| Marketing Analysts | 226,410 | $61,600 | $29.60 | $85,200 | $41.00 | 70,100 | 28.1% |
| Office Secretaries | 1,797,670 | $30,000 | $14.40 | $37,300 | $17.90 | 93,300 | 4.6% |
| Personal Finance Advisors | 149,460 | $68,200 | $32.80 | $116,600 | $56.10 | 62,800 | 30.1% |
| Personnel Supervisors | 369,170 | $92,600 | $44.50 | $123,200 | $59.20 | 65,800 | 7.3% |
| Property Sales Agents | 151,550 | $40,100 | $19.30 | $63,500 | $30.50 | 63,700 | 16.2% |
| Real Estate Sales Brokers | 48,380 | $55,700 | $26.80 | $93,300 | $44.90 | 10,600 | 8.6% |
| Retail Sales Managers | 1,163,040 | $34,900 | $16.80 | $45,700 | $22.00 | 88,400 | 5.3% |
| Retail Salesworkers | 4,209,500 | $20,300 | $9.70 | $27,300 | $13.10 | 374,700 | 8.4% |
| Sales Team Managers | 261,200 | $67,500 | $32.40 | $96,600 | $46.40 | 24,400 | 4.8% |
| Salespeople | 13,715,050 | $23,900 | $11.50 | $41,100 | $19.80 | 980,400 | 6.2% |
| Supervisory Workers | 6,116,380 | $89,300 | $43.00 | $128,300 | $61.70 | 454,300 | 5.1% |
| Technical Clerks | 266,090 | $29,700 | $14.30 | $38,800 | $18.60 | -35,700 | -11.6% |
| Occupation | Employees | Median Annual Salary |
Median Hourly Wage |
Top 25% Annual Salary |
Top 25% Hourly Wage |
2018 Change |
2018 % Change |
|---|---|---|---|---|---|---|---|
| College Administrators | 105,900 | $82,800 | $39.80 | $116,000 | $55.80 | 2,800 | 2.3% |
| College Instructors | 205,760 | $64,700 | $31.10 | $90,300 | $43.40 | NA | NA |
| College Mathematical Science Instructors | 48,100 | $63,600 | $30.60 | $87,100 | $41.90 | NA | NA |
| College Nursing Educators | 49,140 | $61,400 | $29.50 | $78,400 | $37.70 | NA | NA |
| College Philosophy and Religion Instructors | 19,630 | $61,200 | $29.40 | $81,800 | $39.30 | NA | NA |
| College Physics Instructors | 12,870 | $75,100 | $36.10 | $102,100 | $49.10 | NA | NA |
| College Political Science Instructors | 15,180 | $68,800 | $33.10 | $93,500 | $45.00 | NA | NA |
| College Psychology Instructors | 33,450 | $65,800 | $31.60 | $87,700 | $42.20 | NA | NA |
| College Recreation and Fitness Instructors | 16,850 | $55,400 | $26.60 | $76,700 | $36.90 | NA | NA |
| College Social Sciences Instructors | 5,830 | $69,100 | $33.20 | $92,400 | $44.40 | NA | NA |
| College Social Work Instructors | 8,290 | $61,000 | $29.30 | $80,800 | $38.80 | NA | NA |
| College Sociology Instructors | 16,380 | $64,400 | $31.00 | $87,300 | $42.00 | NA | NA |
| College Vocational Education Instructors | 114,420 | $48,000 | $23.10 | $64,000 | $30.80 | NA | NA |
| Elementary Educators | 1,544,300 | $50,500 | $24.30 | $63,600 | $30.60 | 244,200 | 15.8% |
| High School Administrators | 219,280 | $85,200 | $41.00 | $104,100 | $50.00 | 19,800 | 8.6% |
| High School Instructors | 1,091,710 | $52,200 | $25.10 | $66,100 | $31.80 | 96,300 | 8.9% |
| High School Vocational Education Instructors | 92,980 | $52,600 | $25.30 | $64,800 | $31.20 | 9,600 | 9.6% |
| Junior High School Instructors | 665,420 | $50,800 | $24.40 | $64,000 | $30.80 | 101,200 | 15.3% |
| Junior High Vocational Education Instructors | 14,060 | $49,300 | $23.70 | $61,100 | $29.40 | 500 | 3.2% |
| Junior Special Education Instructors | 102,490 | $52,000 | $25.00 | $64,700 | $31.10 | 18,100 | 18.1% |
| Library Employees | 8,488,740 | $45,200 | $21.70 | $62,100 | $29.90 | 1,324,100 | 14.4% |
| Nursery School Teachers | 389,660 | $24,500 | $11.80 | $32,200 | $15.50 | 86,700 | 19.0% |
| Secondary School Special Ed. Instructors | 146,240 | $52,900 | $25.40 | $67,400 | $32.40 | 19,500 | 13.3% |
| Teachers' Aides | 1,275,410 | $22,800 | $11.00 | $28,800 | $13.90 | 134,900 | 10.3% |
| Occupation | Employees | Median Annual Salary |
Median Hourly Wage |
Top 25% Annual Salary |
Top 25% Hourly Wage |
2018 Change |
2018 % Change |
|---|---|---|---|---|---|---|---|
| Architecture Drafters | 105,320 | $45,600 | $21.90 | $57,400 | $27.60 | 10,800 | 9.1% |
| Drafting Engineers | 18,290 | $45,300 | $21.80 | $58,500 | $28.20 | 500 | 2.3% |
| Electronics Designers | 30,590 | $52,100 | $25.00 | $66,300 | $31.90 | 300 | 0.8% |
| Engineers and Architects | 2,412,730 | $68,800 | $33.10 | $92,200 | $44.30 | 270,600 | 10.3% |
| Landscape Design Engineers | 18,940 | $60,600 | $29.10 | $79,900 | $38.40 | 5,300 | 19.7% |
| Machine Designers | 71,890 | $47,800 | $23.00 | $59,700 | $28.70 | -900 | -1.1% |
| Sound Recording Engineers | 15,560 | $46,400 | $22.30 | $67,000 | $32.20 | 1,200 | 6.3% |
| Occupation | Employees | Median Annual Salary |
Median Hourly Wage |
Top 25% Annual Salary |
Top 25% Hourly Wage |
2018 Change |
2018 % Change |
|---|---|---|---|---|---|---|---|
| Cardiographers | 48,070 | $48,300 | $23.20 | $63,000 | $30.30 | 11,900 | 24.1% |
| Certified Respiratory Therapists | 107,270 | $53,300 | $25.60 | $62,600 | $30.10 | 22,100 | 20.9% |
| Clinical Massage Therapists | 55,920 | $35,200 | $16.90 | $51,800 | $24.90 | 23,200 | 18.9% |
| Clinical Medical Assistants | 495,970 | $28,700 | $13.80 | $33,800 | $16.20 | 163,900 | 33.9% |
| Dental Nurses | 173,900 | $67,300 | $32.40 | $80,000 | $38.50 | 62,900 | 36.1% |
| Dental Technicians | 40,480 | $34,800 | $16.70 | $45,100 | $21.70 | 6,400 | 13.9% |
| Emergency Care Technicians | 217,920 | $30,000 | $14.40 | $39,300 | $18.90 | 19,000 | 9.0% |
| General Duty Nurses | 2,583,770 | $63,800 | $30.70 | $78,000 | $37.50 | 581,500 | 22.2% |
| Healthcare Assistants | 3,886,690 | $24,700 | $11.90 | $31,200 | $15.00 | 1,147,100 | 28.8% |
| Healthcare Laboratory Technicians | 152,420 | $36,000 | $17.30 | $45,400 | $21.80 | 25,000 | 16.1% |
| Healthcare Laboratory Technologists | 166,860 | $55,100 | $26.50 | $65,100 | $31.30 | 20,500 | 11.9% |
| Healthcare Services Managers | 271,710 | $81,900 | $39.40 | $106,000 | $51.00 | 45,400 | 16.0% |
| Healthcare Technicians and Practitioners | 7,200,950 | $57,700 | $27.70 | $80,000 | $38.40 | 1,599,600 | 21.4% |
| Healthcare Transcriptionists | 82,810 | $32,600 | $15.70 | $39,000 | $18.80 | 11,700 | 11.2% |
| Industrial Occupational Therapists | 97,840 | $69,600 | $33.50 | $84,200 | $40.50 | 26,800 | 25.6% |
| Licensed Physical Therapist Assistants | 63,750 | $48,300 | $23.20 | $57,800 | $27.80 | 21,200 | 33.3% |
| Licensed Vocational and Practical Nurses | 728,670 | $39,800 | $19.10 | $47,200 | $22.70 | 155,600 | 20.7% |
| Life Coaches | 30,900 | $41,300 | $19.90 | $56,100 | $27.00 | 4,400 | 13.1% |
| Marriage Counselors and Family Therapists | 26,450 | $46,900 | $22.60 | $58,400 | $28.10 | 3,900 | 14.5% |
| Medical Information Technicians | 170,580 | $31,300 | $15.00 | $40,500 | $19.50 | 35,100 | 20.3% |
| Medical Office Specialists | 469,740 | $30,200 | $14.50 | $36,800 | $17.70 | 125,500 | 26.6% |
| Mental Health Therapists | 106,920 | $38,000 | $18.30 | $50,100 | $24.10 | 27,200 | 24.0% |
| Nursing Aides and Orderlies | 1,438,010 | $24,000 | $11.60 | $29,000 | $13.90 | 276,000 | 18.8% |
| Nutritionalists | 53,220 | $52,200 | $25.10 | $63,500 | $30.50 | 5,600 | 9.2% |
| Optical Technicians | 30,580 | $28,200 | $13.60 | $35,800 | $17.20 | 5,200 | 14.7% |
| Oral and Maxillofacial Surgical Doctors | 5,390 | $166,400+ | $80.00+ | $166,400+ | $80.00+ | 1,000 | 15.3% |
| Personal Fitness Trainers | 228,170 | $30,700 | $14.70 | $45,700 | $22.00 | 76,800 | 29.4% |
| Personal Health Assistants | 955,220 | $20,500 | $9.90 | $24,300 | $11.70 | 460,900 | 50.0% |
| Pharmaceutical Assistants | 52,230 | $20,800 | $10.00 | $25,000 | $12.00 | -3,500 | -6.3% |
| Pharmacy Laboratory Technicians | 331,890 | $28,100 | $13.50 | $33,800 | $16.30 | 99,800 | 30.6% |
| Physical Therapy Technicians | 44,160 | $23,900 | $11.50 | $28,900 | $13.90 | 16,700 | 36.3% |
| Physicians' Aides | 76,900 | $84,400 | $40.60 | $99,500 | $47.90 | 29,200 | 39.0% |
| Physiotherapists | 174,490 | $74,500 | $35.80 | $87,900 | $42.30 | 56,200 | 30.3% |
| Radiographer Technologists | 213,560 | $53,200 | $25.60 | $64,100 | $30.80 | 37,000 | 17.2% |
| Radiologic Therapists | 15,570 | $74,200 | $35.70 | $90,700 | $43.60 | 4,100 | 27.1% |
| Recreation Therapy Technicians | 21,960 | $39,400 | $19.00 | $50,400 | $24.20 | 3,400 | 14.6% |
| Registered Respiratory Technicians | 15,100 | $44,700 | $21.50 | $54,900 | $26.40 | -200 | -1.1% |
| Rehabilitation Coordinators | 112,690 | $31,200 | $15.00 | $41,400 | $19.90 | 24,500 | 19.0% |
| School Counselors | 251,050 | $52,600 | $25.30 | $67,200 | $32.30 | 38,600 | 14.0% |
| Speech-Language Therapists | 111,640 | $65,100 | $31.30 | $82,400 | $39.60 | 22,100 | 18.5% |
| Substance Abuse and Behavioral Therapists | 78,470 | $37,700 | $18.10 | $48,100 | $23.10 | 18,100 | 21.0% |
| Surgery Technicians | 91,250 | $39,400 | $18.90 | $47,300 | $22.70 | 23,200 | 25.3% |
| Surgical Dental Assistants | 294,020 | $33,200 | $16.00 | $39,800 | $19.10 | 105,600 | 35.8% |
| Ultrasound Technicians | 51,630 | $63,000 | $30.30 | $74,400 | $35.80 | 9,200 | 18.3% |
| Occupation | Employees | Median Annual Salary |
Median Hourly Wage |
Top 25% Annual Salary |
Top 25% Hourly Wage |
2018 Change |
2018 % Change |
|---|---|---|---|---|---|---|---|
| Culinary Supervisors | 190,250 | $47,200 | $22.70 | $61,100 | $29.40 | 18,000 | 5.3% |
| Deli Cooks | 166,140 | $19,500 | $9.40 | $23,600 | $11.30 | 100 | 0.1% |
| Food Preparers and Server Supervisors | 791,750 | $29,500 | $14.20 | $37,900 | $18.20 | 55,100 | 6.6% |
| Food Servers and Preparers | 11,218,260 | $18,500 | $8.90 | $23,000 | $11.10 | 1,007,600 | 8.7% |
| Food Service Aides | 849,400 | $19,000 | $9.20 | $23,000 | $11.10 | 37,800 | 4.2% |
| Head Chefs | 94,300 | $40,100 | $19.30 | $53,500 | $25.70 | 200 | 0.2% |
| Line Cooks | 19,210 | $22,900 | $11.00 | $29,400 | $14.10 | 2,900 | 16.3% |
| Lounge and Coffee Shop Hosts and Hostesses | 334,310 | $18,100 | $8.70 | $20,600 | $9.90 | 22,800 | 6.5% |
| Meeting and Convention Directors | 51,530 | $44,800 | $21.50 | $58,100 | $28.00 | 8,800 | 15.6% |
| Motel and Hotel Managers | 31,660 | $46,300 | $22.30 | $63,900 | $30.70 | 2,800 | 4.7% |
| Pastry Bakers | 140,510 | $23,600 | $11.40 | $30,100 | $14.50 | 300 | 0.2% |
| Personal Care Technicians | 3,461,910 | $20,800 | $10.00 | $27,700 | $13.30 | 1,030,600 | 20.4% |
| Personal Chefs | 770 | $24,700 | $11.90 | $31,100 | $15.00 | 200 | 4.3% |
| School Cooks | 383,540 | $22,600 | $10.90 | $28,100 | $13.50 | 37,900 | 9.7% |
| Sous Chefs | 898,820 | $22,200 | $10.70 | $26,600 | $12.80 | 70,300 | 7.7% |
| Travel Counselors | 76,990 | $30,800 | $14.80 | $38,400 | $18.50 | -1,200 | -1.1% |
| Occupation | Employees | Median Annual Salary |
Median Hourly Wage |
Top 25% Annual Salary |
Top 25% Hourly Wage |
2018 Change |
2018 % Change |
|---|---|---|---|---|---|---|---|
| Attorney Law Clerks | 18,780 | $47,800 | $23.00 | $67,400 | $32.40 | 3,900 | 18.3% |
| Defense Attorneys | 556,790 | $113,200 | $54.40 | $166,400+ | $80.00+ | 98,500 | 13.0% |
| Forensic Analysts | 12,870 | $51,500 | $24.80 | $66,200 | $31.80 | 2,500 | 19.6% |
| Jailkeepers | 455,350 | $39,100 | $18.80 | $52,200 | $25.10 | 42,900 | 9.4% |
| Legal Administrative Assistants | 244,380 | $41,100 | $19.80 | $52,300 | $25.20 | 48,400 | 18.4% |
| Legal and Judicial Workers | 999,020 | $74,000 | $35.60 | $128,400 | $61.70 | 188,400 | 15.1% |
| Paralegals and Law Assistants | 246,810 | $47,000 | $22.60 | $60,600 | $29.10 | 74,100 | 28.1% |
| Police Investigators | 110,380 | $62,100 | $29.90 | $83,700 | $40.20 | 18,700 | 16.6% |
| Private Investigators | 31,250 | $42,100 | $20.30 | $57,900 | $27.80 | 10,000 | 22.0% |
| Protection Servants | 3,172,420 | $36,200 | $17.40 | $54,700 | $26.30 | 400,100 | 12.2% |
| Occupation | Employees | Median Annual Salary |
Median Hourly Wage |
Top 25% Annual Salary |
Top 25% Hourly Wage |
2018 Change |
2018 % Change |
|---|---|---|---|---|---|---|---|
| Publicists | 242,670 | $52,000 | $25.00 | $72,200 | $34.70 | 66,200 | 24.0% |
| Specifications Writers | 46,270 | $62,700 | $30.20 | $80,500 | $38.70 | 8,900 | 18.2% |
| TV and Radio Announcers | 35,130 | $27,500 | $13.20 | $42,300 | $20.30 | -3,400 | -6.1% |
| Occupation | Employees | Median Annual Salary |
Median Hourly Wage |
Top 25% Annual Salary |
Top 25% Hourly Wage |
2018 Change |
2018 % Change |
|---|---|---|---|---|---|---|---|
| Environmental Protection Foresters | 10,230 | $53,800 | $25.90 | $65,800 | $31.60 | 1,400 | 12.1% |
| Farming and Fishing Workers | 419,200 | $19,600 | $9.40 | $26,700 | $12.80 | -9,100 | -0.9% |
| Forestry Aides | 31,440 | $32,900 | $15.80 | $43,500 | $20.90 | 2,900 | 8.6% |
| Laboratory Animal Caretakers | 71,350 | $21,700 | $10.40 | $26,700 | $12.80 | 17,100 | 22.8% |
| Land Survey Technicians | 62,940 | $37,200 | $17.90 | $48,700 | $23.40 | 15,700 | 20.4% |
| Survey Engineers | 50,360 | $54,200 | $26.10 | $72,100 | $34.70 | 8,600 | 14.9% |
| Veterinary Laboratory Assistants | 79,200 | $29,300 | $14.10 | $35,900 | $17.30 | 28,500 | 35.8% |
| Occupation | Employees | Median Annual Salary |
Median Hourly Wage |
Top 25% Annual Salary |
Top 25% Hourly Wage |
2018 Change |
2018 % Change |
|---|---|---|---|---|---|---|---|
| Community and Social Servants | 1,891,320 | $39,000 | $18.70 | $53,000 | $25.50 | 448,400 | 16.5% |
| Healthcare Social Workers | 133,510 | $46,300 | $22.30 | $58,500 | $28.10 | 31,100 | 22.4% |
| School Psychologists | 98,330 | $66,000 | $31.80 | $85,300 | $41.00 | 16,800 | 11.1% |
| School Social Workers | 277,670 | $40,000 | $19.20 | $52,400 | $25.20 | 36,100 | 12.3% |
| Social and Community Service Leaders | 113,760 | $56,600 | $27.20 | $74,500 | $35.80 | 18,000 | 13.8% |
| Social and Human Service Aides | 344,050 | $27,900 | $13.40 | $35,600 | $17.10 | 79,400 | 22.6% |
| Social Science Workers | 1,308,380 | $58,300 | $28.00 | $82,000 | $39.40 | 277,200 | 19.0% |
| Social Servants | 73,250 | $49,400 | $23.80 | $62,800 | $30.20 | 9,400 | 12.8% |
| Substance Abuse and Mental Health Workers | 127,140 | $38,200 | $18.40 | $49,800 | $24.00 | 26,800 | 19.5% |
| Occupation | Employees | Median Annual Salary |
Median Hourly Wage |
Top 25% Annual Salary |
Top 25% Hourly Wage |
2018 Change |
2018 % Change |
|---|---|---|---|---|---|---|---|
| Audio-Visual Equipment Technicians | 46,070 | $39,100 | $18.80 | $53,700 | $25.80 | 7,000 | 12.6% |
| Computer Scientists | 26,130 | $101,600 | $48.80 | $127,600 | $61.40 | 7,000 | 24.2% |
| Computer Systems and Network Administrators | 338,890 | $67,700 | $32.60 | $85,800 | $41.30 | 78,900 | 23.2% |
| Computer Workers and Mathematicians | 3,303,690 | $72,900 | $35.10 | $95,900 | $46.10 | 785,700 | 22.2% |
| Data Communications and Network Analysts | 226,080 | $73,300 | $35.20 | $94,300 | $45.40 | 155,800 | 53.4% |
| Database Specialists | 108,080 | $71,600 | $34.40 | $93,300 | $44.80 | 24,400 | 20.3% |
| Desktop Support Specialists | 540,560 | $44,300 | $21.30 | $57,300 | $27.50 | 78,000 | 13.8% |
| Information Systems Consultants | 512,720 | $77,100 | $37.10 | $97,200 | $46.70 | 108,100 | 20.3% |
| Operating System Designers | 385,200 | $93,500 | $44.90 | $116,500 | $56.00 | 120,200 | 30.4% |
| Operating System Programmers | 367,880 | $70,900 | $34.10 | $91,000 | $43.80 | -12,300 | -2.9% |
| Software Applications Engineers | 495,500 | $87,500 | $42.10 | $107,700 | $51.80 | 175,100 | 34.0% |
| System Architects | 195,890 | $77,000 | $37.00 | $96,900 | $46.60 | 27,500 | 13.1% |
| Videographers | 31,220 | $33,000 | $15.90 | $49,600 | $23.80 | 700 | 1.8% |
| Occupation | Employees | Median Annual Salary |
Median Hourly Wage |
Top 25% Annual Salary |
Top 25% Hourly Wage |
2018 Change |
2018 % Change |
|---|---|---|---|---|---|---|---|
| Aircraft Mechanics Technicians | 112,130 | $52,800 | $25.40 | $61,700 | $29.70 | 7,800 | 6.4% |
| Auto Body Technicians | 133,290 | $38,000 | $18.30 | $50,000 | $24.10 | 800 | 0.5% |
| Automotive Mechanics | 606,990 | $35,400 | $17.00 | $47,200 | $22.70 | 35,900 | 4.7% |
| Barber Shop Operators | 10,550 | $24,200 | $11.60 | $31,500 | $15.10 | 6,200 | 11.6% |
| Bus, Truck, and Diesel Engine Mechanics | 232,810 | $40,300 | $19.40 | $49,700 | $23.90 | 14,900 | 5.7% |
| Construction Electricians | 579,150 | $47,200 | $22.70 | $63,100 | $30.40 | 83,000 | 11.9% |
| Construction Workers and Extractors | 5,751,630 | $38,800 | $18.60 | $54,300 | $26.10 | 1,018,600 | 13.0% |
| Cosmetologists and Hairdressers | 349,210 | $23,300 | $11.20 | $31,500 | $15.10 | 127,000 | 20.1% |
| Delivery Truck Drivers | 834,780 | $28,300 | $13.60 | $38,000 | $18.30 | 41,400 | 4.2% |
| Equipment Operating Engineers | 368,200 | $39,800 | $19.10 | $53,700 | $25.80 | 48,700 | 12.0% |
| Healthcare Equipment Technicians | 34,550 | $42,300 | $20.30 | $55,300 | $26.60 | 11,300 | 27.2% |
| Heavy Truck and Tractor-Trailer Drivers | 1,550,930 | $37,700 | $18.10 | $47,100 | $22.60 | 232,900 | 13.0% |
| Household Appliance Servicers | 34,670 | $34,200 | $16.40 | $43,200 | $20.80 | 1,100 | 2.2% |
| Installation and Maintenance Specialists | 5,114,150 | $39,600 | $19.00 | $53,000 | $25.50 | 440,200 | 7.6% |
| Lock and Safe Technicians | 16,910 | $35,800 | $17.20 | $47,000 | $22.60 | 2,700 | 12.0% |
| Manicure and Pedicure Technicians | 53,020 | $19,700 | $9.50 | $25,000 | $12.00 | 14,300 | 18.8% |
| Material Transportation Workers | 8,844,700 | $28,000 | $13.50 | $38,900 | $18.70 | 391,100 | 4.0% |
| Mechanical Technicians | 380,720 | $37,700 | $18.10 | $47,000 | $22.60 | -19,300 | -4.6% |
| Mobile Heavy Equipment Technicians | 120,450 | $44,100 | $21.20 | $53,400 | $25.70 | 11,800 | 8.7% |
| Motorcycle Repairers | 16,070 | $31,800 | $15.30 | $40,200 | $19.30 | 1,600 | 8.8% |
| Outboard Motor Mechanics | 18,180 | $35,400 | $17.00 | $44,700 | $21.50 | 1,200 | 5.6% |
| Outdoor Power Equipment Service Technicians | 26,010 | $29,300 | $14.10 | $36,000 | $17.30 | 1,900 | 6.4% |
| Plumbers and Pipefitters | 400,970 | $46,300 | $22.30 | $62,400 | $30.00 | 75,800 | 15.3% |
| Producing Workers | 8,927,130 | $30,000 | $14.40 | $40,300 | $19.40 | -349,200 | -3.5% |
| Recreational Vehicle Repairers | 10,860 | $32,200 | $15.50 | $40,100 | $19.30 | 900 | 6.6% |
| Refrigeration Mechanics and Installers | 244,410 | $41,100 | $19.80 | $53,700 | $25.80 | 86,600 | 28.1% |
| Shampoo Technicians | 16,170 | $17,900 | $8.60 | $20,400 | $9.80 | 3,400 | 14.6% |
| Telecommunications Line Technicians | 162,400 | $49,100 | $23.60 | $62,200 | $29.90 | 1,600 | 0.9% |
| Welders, Cutters, and Solderers | 357,740 | $34,800 | $16.70 | $42,400 | $20.40 | -6,700 | -1.6% |
| Welding and Brazing Machine Operators | 41,580 | $32,800 | $15.70 | $39,500 | $19.00 | -3,800 | -7.1% |